en
en  de
de  ar
ar  es
es  nl
nl  hi
hi  fr
fr  it
it  pt
pt  el
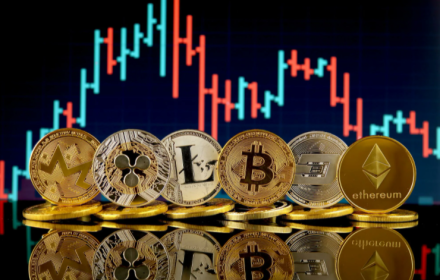
el Brokers no longer shout on exchanges. They have been replaced by millions of retail traders — with concern in their eyes and a smartphone in hand. But the emotions remain the same. They are still at the helm — panic and greed lead the game. It is they who dictate behavior, sometimes more than any fundamental news. This effect has raised the cryptocurrency fear and greed index — a concise but informative indicator. It has learned to diagnose general panic and frenzy.
How the Crypto Thermometer Emerged
The Fear and Greed Index formula first appeared in the stock market. CNNMoney developed it for stocks. Later, the adaptation for cryptocurrency turned the indicator into one of the most discussed market analysis triggers for cryptocurrencies.

The adapted version was based on the behavior of participants in the bitcoin market, aggregating data from several independent sources. In a short period, the cryptocurrency fear and greed index became part of the daily routine of traders and investors seeking subtle entry or exit signals.
Calculation Mechanics
The cryptocurrency fear and greed index fluctuates from 0 to 100. The closer to zero — the deeper the panic, the closer to one hundred — the stronger the greed. It is updated daily and relies on 6 data sources:
- Market Volatility — comparing the current BTC price with its 30-day and 90-day averages. Sharp jumps are interpreted as concern.
- Impulse and Volumes — interest growth alongside price increase indicates greed.
- Social Signals — number of mentions and growth rates for the search term “Bitcoin” and derivatives on Google Trends.
- Surveys and Opinions — historically conducted manually, temporarily frozen.
- Bitcoin (BTC) Dominance — BTC share growth is interpreted as concern (exodus from alts), decrease as greed (hunt for profit).
- Search Trends — tracking demand for phrases like “crypto crash,” “how to sell BTC fast,” and other panic markers.
The combination of these parameters yields a single value — daily, at 00:00 UTC. A value below 25 indicates extreme fear, above 75 indicates extreme greed.
How to Use the Cryptocurrency Fear and Greed Index
In real trading, it is useful when working at range boundaries. Traders and investors use it as a contrarian indicator — counter-trend filter.
Example: on March 12, 2020, the index showed 10 — the lowest level in history. It was then that Bitcoin dropped below $5,000. A month later — recovery to $7,000.
And vice versa: in November 2021, the index soared above 75 amid BTC rising above $60,000. After that, a reversal began.
Application of the Cryptocurrency Fear and Greed Index
The cryptocurrency fear and greed index does not give a “buy/sell” signal, but helps interpret the market.
Finding a Profitable Entry Point
A low level (0–25) signals potential oversold conditions. At the same time, technical indicators (RSI, MACD) also confirm a potential reversal — an opportunity to “go against the crowd.”
Profit Taking
A high value (75–100) amid growing FOMO may signal excessive enthusiasm. This moment is a signal to reduce positions or take profits.
Assessing Altcoin Sentiment
When the index drops, altcoins often lose liquidity faster than BTC. Skillful sentiment interpretation helps predict sharper movements outside the bitcoin sector.
Mass Psychology: From Fear to FOMO and Back
The mood of the cryptocurrency market depends on the news background, actions of major holders, and even tweets of individual persons. Panic spreads faster than common sense.
Fear acts as a lever. Concern triggers sell-offs. Desire for profit pushes towards impulsive purchases.
FOMO, or fear of missing out, often accompanies extreme greed. A reading of 90+ is a clear signal of overheating and the entry of the “late majority.”
Common Mistakes in Interpreting the Indicator
The cryptocurrency fear and greed index provides a powerful but sensitive tool. Errors in its use reduce decision-making effectiveness:
- Ignoring the Long-Term Trend. The indicator is relevant only in the context of the macro trend.
- Direct Reaction. A high level does not mean an immediate drop, and a low level does not mean an immediate rise.
- Failure to Perform Comprehensive Analysis. The indicator should complement, not replace, technical and fundamental analysis.
- Use without Time Interval Filter. Indicators are short-term. Aggregation by periods is important for weekly and monthly decisions.
- Substitution of Logic with Emotions. Helps avoid emotional decisions, but blind adherence creates new pitfalls.
Connection with Other Indicators
The cryptocurrency fear and greed index enhances its value when combined with other metrics:
- RSI (Relative Strength Index) — identifies overbought/oversold zones.
- Trading Volume — confirms the truth of the impulse.
- Market Structure (Order Book, Liquidations) — complements crowd behavior.
- Derivatives Data — futures and options provide a signal about institutional sentiment.
This approach turns the index into a signaling lamp — not a control system, but a directional hint for decisions based on specific risks.
Nuances and Limitations
Market volatility directly affects the accuracy of the indicator. During a flat market, the BTC index is often underestimated — volumes decrease, and interest wanes. But fear may not actually be present. During news peaks, it reacts to emotions, losing stability. Here, a manual filter or an extended slice is needed.
Applying the index to altcoins in isolation is not advisable. Their dynamics are determined by tokenomics, liquidity, holdings, and blockchain connection. Even with similar sentiment, behavior can differ.
Adapting the Index for DeFi, NFT, and Other Sectors
The calculation principle remains tailored to BTC and major alts. Within the cryptocurrency market analysis, an extended interpretation allows adapting it to the DeFi sector:
- For NFTs — measuring activity on Twitter, platform growth (OpenSea, Blur), and dynamics of terms like “rug pull,” “pump,” etc.
- In DeFi — analyzing Total Value Locked (TVL), DAO behavior, and changes in APR on platforms.
- In Layer-2 — activity growth, token bridge, and cross-chain transactions.
Formally, these metrics are not part of the original Fear and Greed Index. Indirect correlation with the base metric allows building extended sentiment models.
The Future of the Cryptocurrency Fear and Greed Index
With the development of AI and on-chain analytics, the fear and greed indicator may evolve into a dynamic strategic metric tied to:
- Real liquidity volume (via DEX/CEX API).
- Wallet activity (new addresses, movements).
- AI sentiment analysis on social media (thematic NLP).
It will transform from a guide into a component of a system for automated trading and risk assessment.
Conclusion
The cryptocurrency fear and greed index does not replace technical analysis and does not predict BTC price. It reflects crowd sentiment — from panic to euphoria — and helps avoid emotional decision-making. This indicator does not pinpoint entry points, but advises when to keep a cool head. Using it wisely means protecting against FOMO and avoiding herd mentality.